


FishTrack - Charts & Forecasts
アプリについての本文は英語です。
- 55 100点中 · レビュー
- 4.65点中 · ストア
- 6,198件の評価(App Store)
- 95件のレビューを分析
保存されたレビューの編集部による読み解き
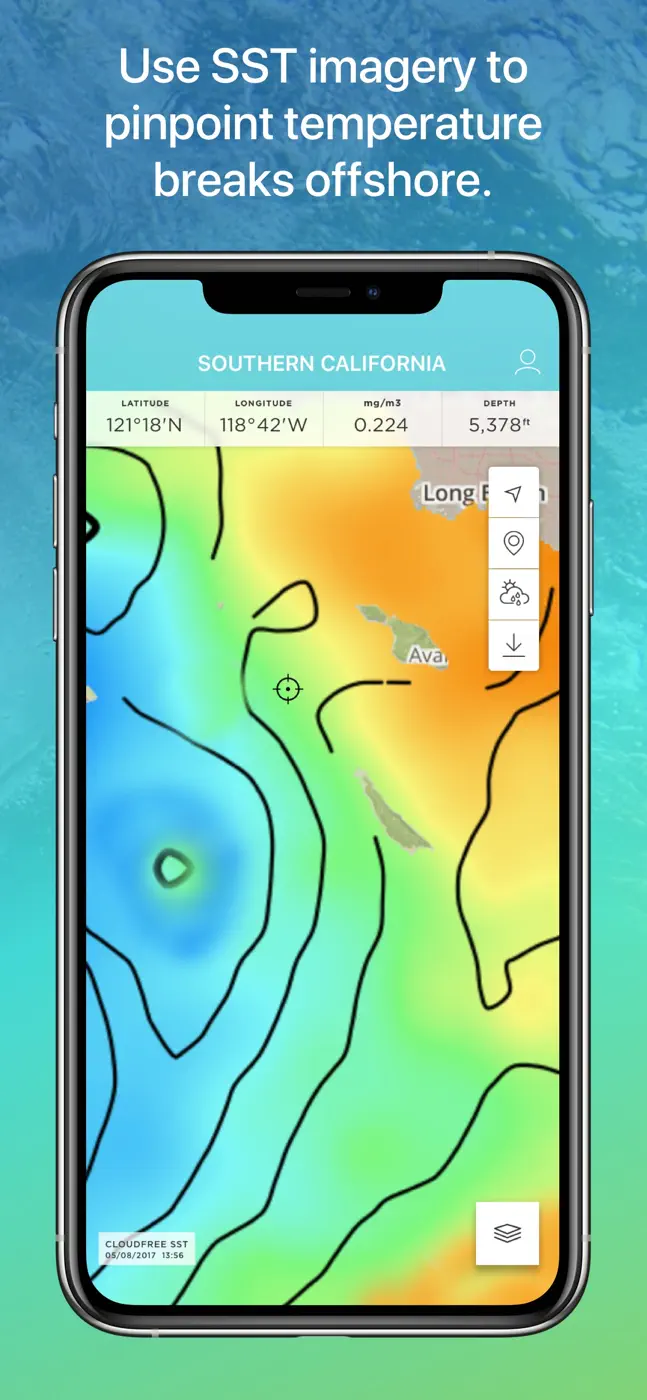
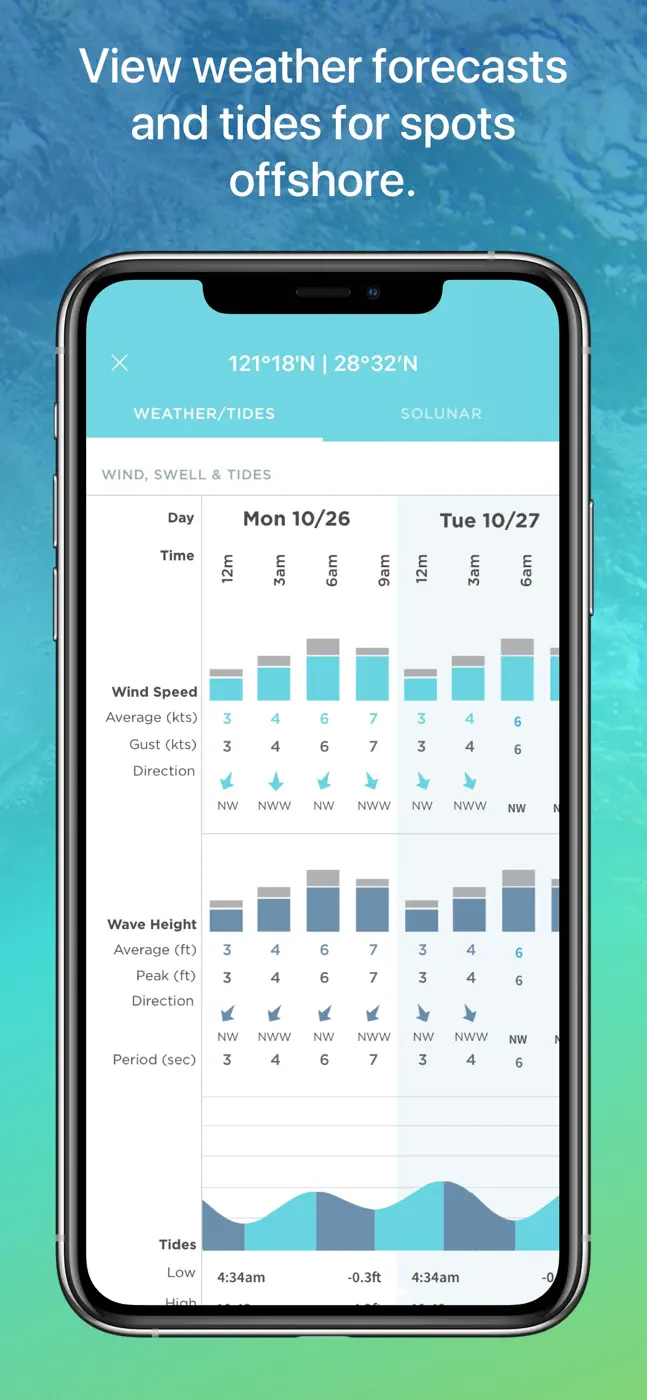
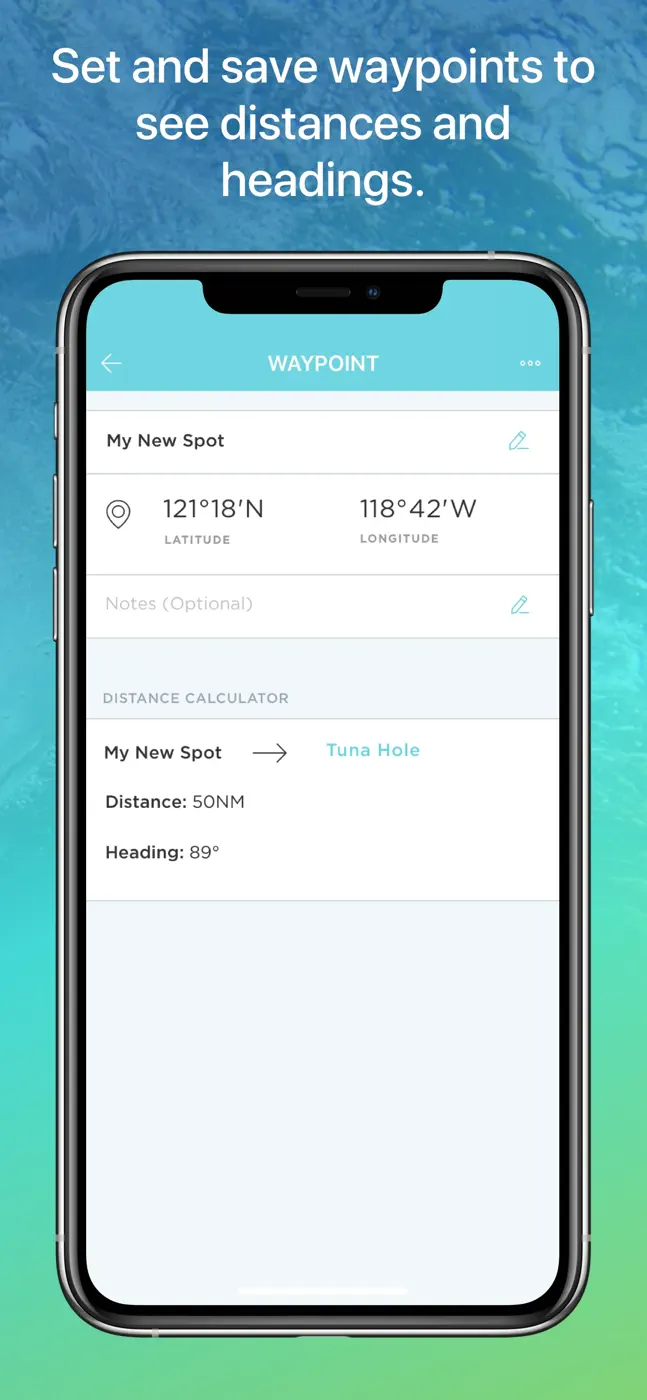
The core value is finding warm water and temperature breaks before heading offshore, then punching the coordinates straight into a chart plotter. It stumbles on coverage: no Gulf of Mexico, bathymetry stops at southern New Jersey, images often fail to load. It's pricey at around 79 dollars a year, and one guide flatly says he gets the same data free from NASA Worldview.
スクリーンショット
どんな用途で使われているか
Offshore anglers hunting temperature breaks who run a chart plotter
レビューでほめられている点
Accurate sea surface temperatures, finding temperature breaks before a trip, coordinates straight into a chart plotter, monthly billing option
レビューで不満が出ている点
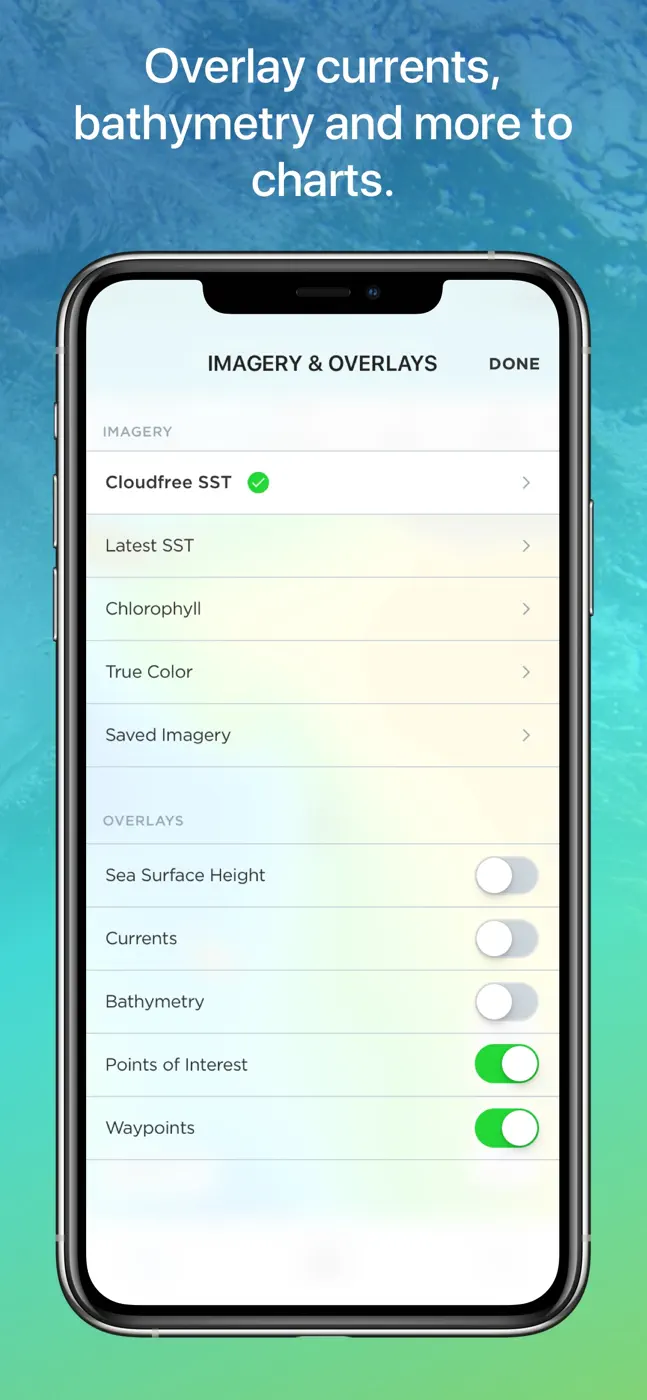
Poor bathymetry, narrow regional coverage, images often don't load, high price, trouble accessing paid features
このテーマのほかのアプリ


これはinAppのアーカイブの資料です。インストールの前に、ストアでアプリの現在の条件と機能を確認してください。