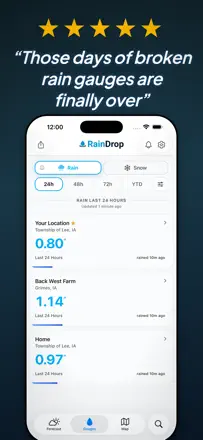
A RainDrop author compares the data with his rain gauge. The summary benefits from a source and a period, so that a model estimate is not mixed with a local measurement.
Quelles apps les gens utilisent
Ces apps sont mentionnées dans le décryptage de cette tâche. Ouvre chacune pour comparer les points forts et les limites. L’ordre de la liste n’est pas un classement d’adéquation.
Rang 17. Note des avis : 58 sur 100. Note sur l’App Store : 4,6★ · 10 936 notes
58sur 100
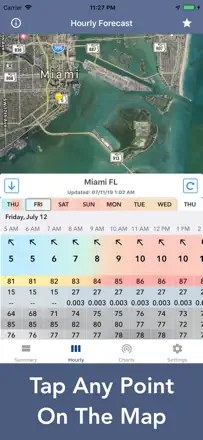
The app is valued for its graphical precipitation accuracy and an honest 14-day horizon without extra noise. The hourly forecast periodically breaks and shows only one time slot, making it a useless widget until the next refresh.
Points forts : Accurate precipitation figures without panic or unnecessary dramatization.
Reproches : The hourly forecast sometimes collapses to a single 1 a.m. row and stops updating without a reinstall.
Pour qui : Those planning trips, outdoor work, or farming tasks two weeks out
Rang 40. Note des avis : 44 sur 100. Note sur l’App Store : 4,7★ · 19 566 notes
44sur 100
An app with a unique niche for tracking rainfall for farmers and agronomists, and when the data matches a physical rain gauge it is irreplaceable. But systematically underreporting actual precipitation by 30-40% compared to physical measurements is the key accuracy problem.
Points forts : Historical precipitation data for a specific map point without needing to go check a physical gauge.
Reproches : Precipitation data regularly underreports physical gauge readings by a third or more.
Pour qui : Farmers and agronomists monitoring plot moisture
Rang 15. Note des avis : 58 sur 100. Note sur l’App Store : 4,6★ · 27 805 notes
58sur 100
Tomorrow.io outperforms most competitors on hyperlocal precipitation forecasts tied to exact map coordinates, but the 10-day forecast is unstable, sunrise/sunset times show an offset, and push notifications regularly fail to fire.
Points forts : Precipitation forecast is tied to precise coordinates rather than the city as a whole, which matters most in areas with complex terrain.
Reproches : The daily and hourly forecasts sometimes contradict each other, which is confusing when planning.
Pour qui : Those for whom it matters whether rain will fall here in the next hour
Rang 8. Note des avis : 63 sur 100. Note sur l’App Store : 4,6★ · 12 074 notes
63sur 100
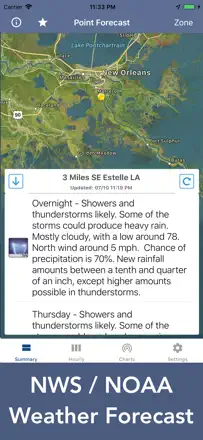
A clean, ad-free interface layered over NWS data, with a forecast discussion forum. Accuracy is good in spring and summer, slightly weaker in winter. The most honest minimalism in the segment.
Points forts : The NWS forecaster Forecast Discussion is the most informative text forecast available, something no other app offers.
Reproches : Zone and acronym navigation is opaque for newcomers, and switching regions takes extra steps.
Pour qui : US users who want raw NWS data without extra layers
Rang 58. Note des avis : 40 sur 100. Note sur l’App Store : 4,6★ · 8 964 notes
40sur 100
Pleasant visuals and hyperlocal forecast for rural areas where the nearest airport station is far away, but accuracy is inconsistent. Radar maps without a legend are nearly useless, and unit settings reset on their own.
Points forts : Hyperlocal forecast is useful in remote areas where the nearest weather station is 30 miles away.
Reproches : The radar has no color legend, so it is impossible to read precipitation intensity from the map.
Pour qui : Farmers and small-town residents in the US Midwest